Today we take a look at the simplest method to create a running total in Power BI desktop.
So without further adieu lets get started.
Scenario :We have the below table created in Power BI desktop with the help of "Financial" excel file that comes in built with Power bi desktop.
![](https://static.wixstatic.com/media/8cef8a_31b28af9602741f3b90487805293629d~mv2.png/v1/fill/w_353,h_507,al_c,q_85,enc_auto/8cef8a_31b28af9602741f3b90487805293629d~mv2.png)
Now we just need to create a running total using the Quick Measure option.
Step1 : Go to the 3 dots in the right side of the Financial Fields as shown below
![](https://static.wixstatic.com/media/8cef8a_0a0eaca58f874bfca4ead55ca633908d~mv2.png/v1/fill/w_222,h_137,al_c,q_85,enc_auto/8cef8a_0a0eaca58f874bfca4ead55ca633908d~mv2.png)
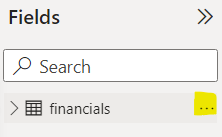
Step 2 : Right click and go to option "New Quick Measure"
![](https://static.wixstatic.com/media/8cef8a_a84484b367cf4a2ba160964e53af5444~mv2.png/v1/fill/w_221,h_210,al_c,q_85,enc_auto/8cef8a_a84484b367cf4a2ba160964e53af5444~mv2.png)
Step 3 :Go to "Running total" option
![](https://static.wixstatic.com/media/8cef8a_e1c3a31e75d74e88991079a28a31b776~mv2.png/v1/fill/w_671,h_457,al_c,q_85,enc_auto/8cef8a_e1c3a31e75d74e88991079a28a31b776~mv2.png)
Step 4 : Give the base value .i.e the value whose running total you want .In our case its Sales
![](https://static.wixstatic.com/media/8cef8a_c99d523ce5a449a7b750be7b54495f30~mv2.png/v1/fill/w_595,h_310,al_c,q_85,enc_auto/8cef8a_c99d523ce5a449a7b750be7b54495f30~mv2.png)
Step 5: Go to Field and drag and drop the Date column since you want sales for the date range
![](https://static.wixstatic.com/media/8cef8a_de2299103c484a18a98d67ea51078709~mv2.png/v1/fill/w_660,h_410,al_c,q_85,enc_auto/8cef8a_de2299103c484a18a98d67ea51078709~mv2.png)
Step 6: Click ok to confirm
![](https://static.wixstatic.com/media/8cef8a_dcb6e6e1709b49b19909231560f7a2c6~mv2.png/v1/fill/w_826,h_860,al_c,q_90,enc_auto/8cef8a_dcb6e6e1709b49b19909231560f7a2c6~mv2.png)
Step 7 :Just pull this in the visual and you get the below running total and that's it .You are done
![](https://static.wixstatic.com/media/8cef8a_bb0229ff4fa74c57bd3dbdc3f6238efc~mv2.png/v1/fill/w_612,h_495,al_c,q_85,enc_auto/8cef8a_bb0229ff4fa74c57bd3dbdc3f6238efc~mv2.png)
If you want to see the underlying autogenerated DAX ,just select the measure and you will get the below code.
![](https://static.wixstatic.com/media/8cef8a_854bd1f1e5af408781c84551b3a6ca8b~mv2.png/v1/fill/w_630,h_187,al_c,q_85,enc_auto/8cef8a_854bd1f1e5af408781c84551b3a6ca8b~mv2.png)
You can watch the below video for details
More Video from Powerbizone. Below is on Time Intelligence using totalytd and datesytd
SamePeriodLastYear DAX Explained in below video
Comments